Correlation Can Be Good:
What Matters Is the Process
The conventional wisdom is that correlation between people's estimates is bad for collective intelligence — correlated errors don't cancel out. But this framing is too simple. Correlation that results from calibrated social influence — where more accurate people have more influence — can improve both individual and crowd accuracy. What matters is not how correlated people are, but what process generates the correlation.
Overview
This project brings together two complementary lines of research. The first (Pilgrim & Becker, arXiv) shows that social communication reliably improves individual accuracy even when group accuracy gets worse — and derives a mathematical decomposition that explains why. The second (CI Abstract 2024) shows that even a perfectly accurate crowd can make the wrong decision by vote, because the crowd average and the plurality vote can be statistically "decoupled."
Paper 1 — Individual vs Crowd Accuracy After Social Influence
Citation: Pilgrim & Becker (2024). "Communication Reliably Improves Individual But Not Group Accuracy." arXiv:2407.00199.
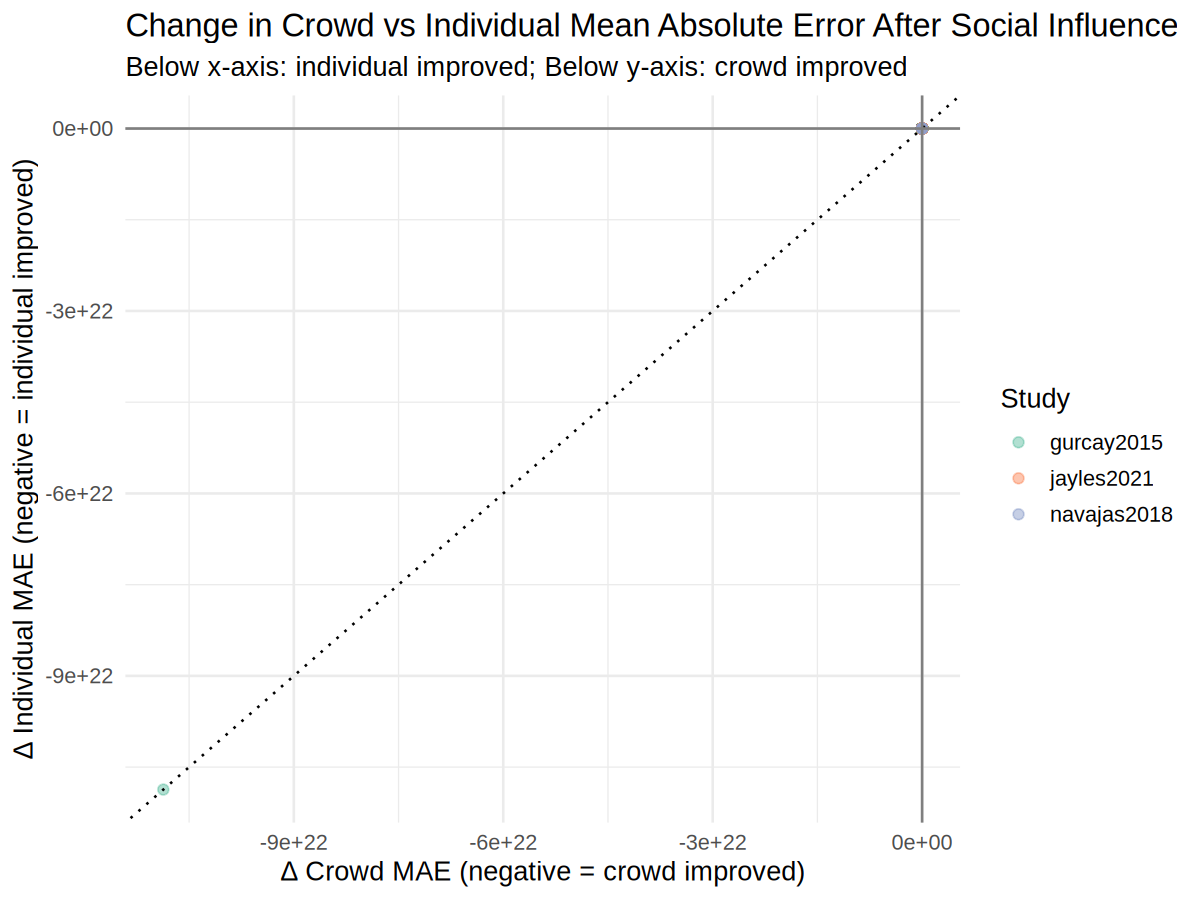
Core Decomposition
After social influence, the change in mean squared error decomposes as:
ΔInd_MSE = ΔCrowd_MSE − ΔVariance
──────────────────────────────────────────────────────
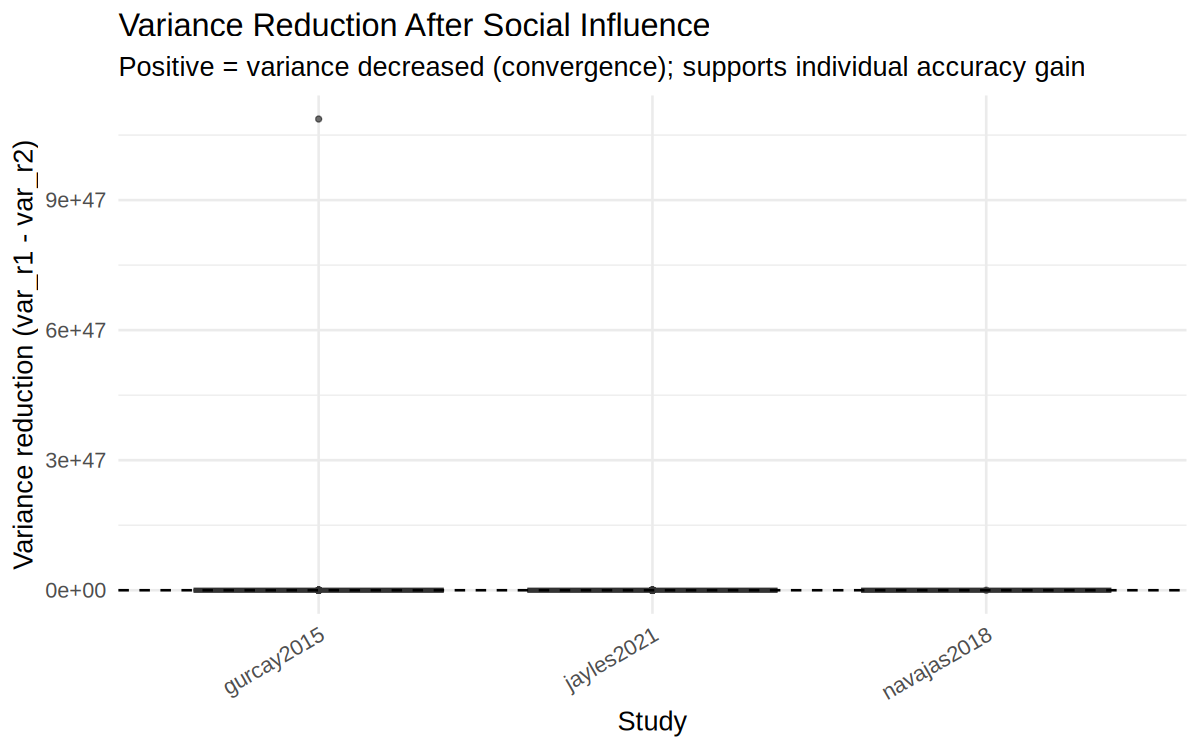
Because ΔVariance < 0 almost always (opinions converge),
ΔInd_MSE < ΔCrowd_MSE → individuals reliably improve
even when the crowd average gets worse.
Key Components
- Calibration: correlation between influence weight and initial accuracy (positive = good for crowd).
- Herding: correlation between influence weight and being close to the mean (can be negative for crowd).
- Centralization: how concentrated influence is in the network.
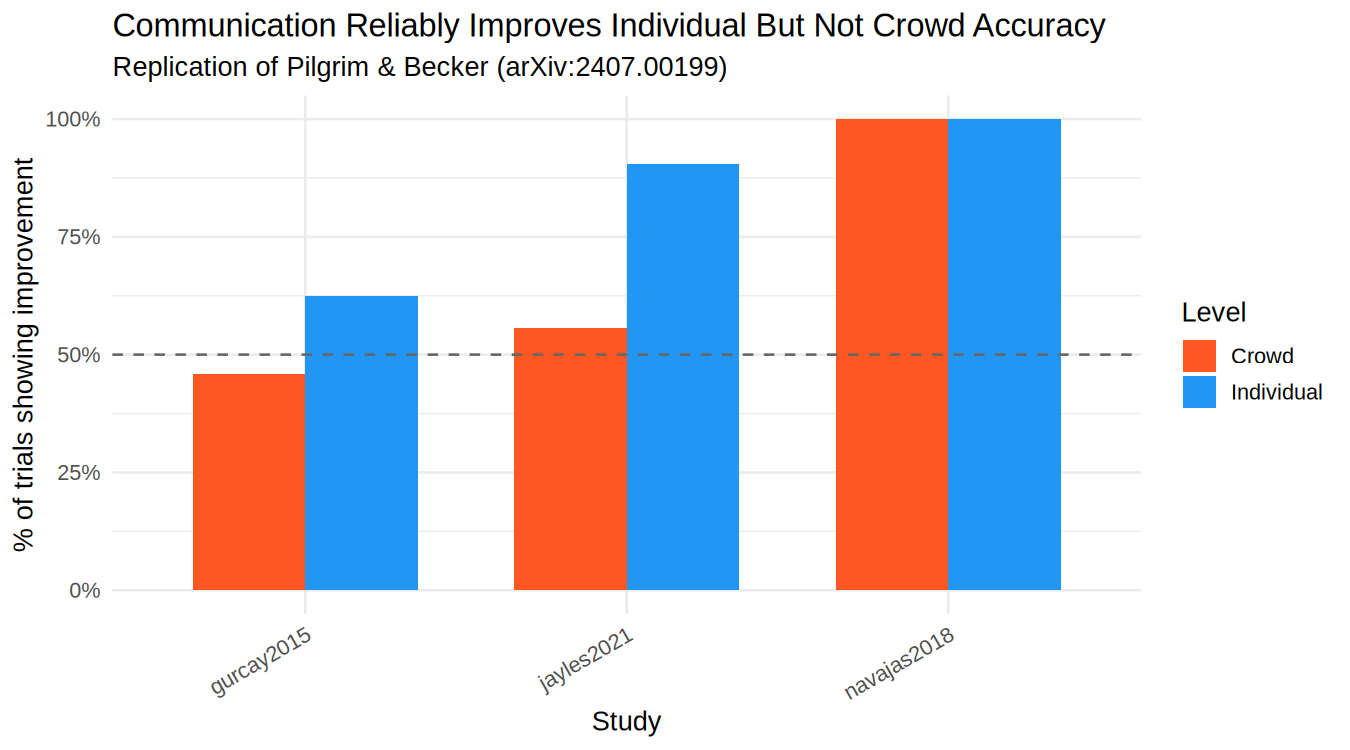
Empirical Findings (6 datasets)
| Study | N | P(Individual Improves) | P(Crowd Improves) | Key Takeaway |
|---|---|---|---|---|
| Gurcay et al. 2015 | — | computing… | computing… | Unbounded + bounded questions |
| Navajas et al. 2018 | — | computing… | computing… | Social influence with swarms |
| Jayles et al. 2021 | — | computing… | computing… | Sorted vs random social info |
| Becker et al. 2017 | — | computing… | computing… | Network centralization effects |
Table shows proportion of group-question trials where accuracy improved after social influence. Results are computed live from the R pipeline output.
Figures
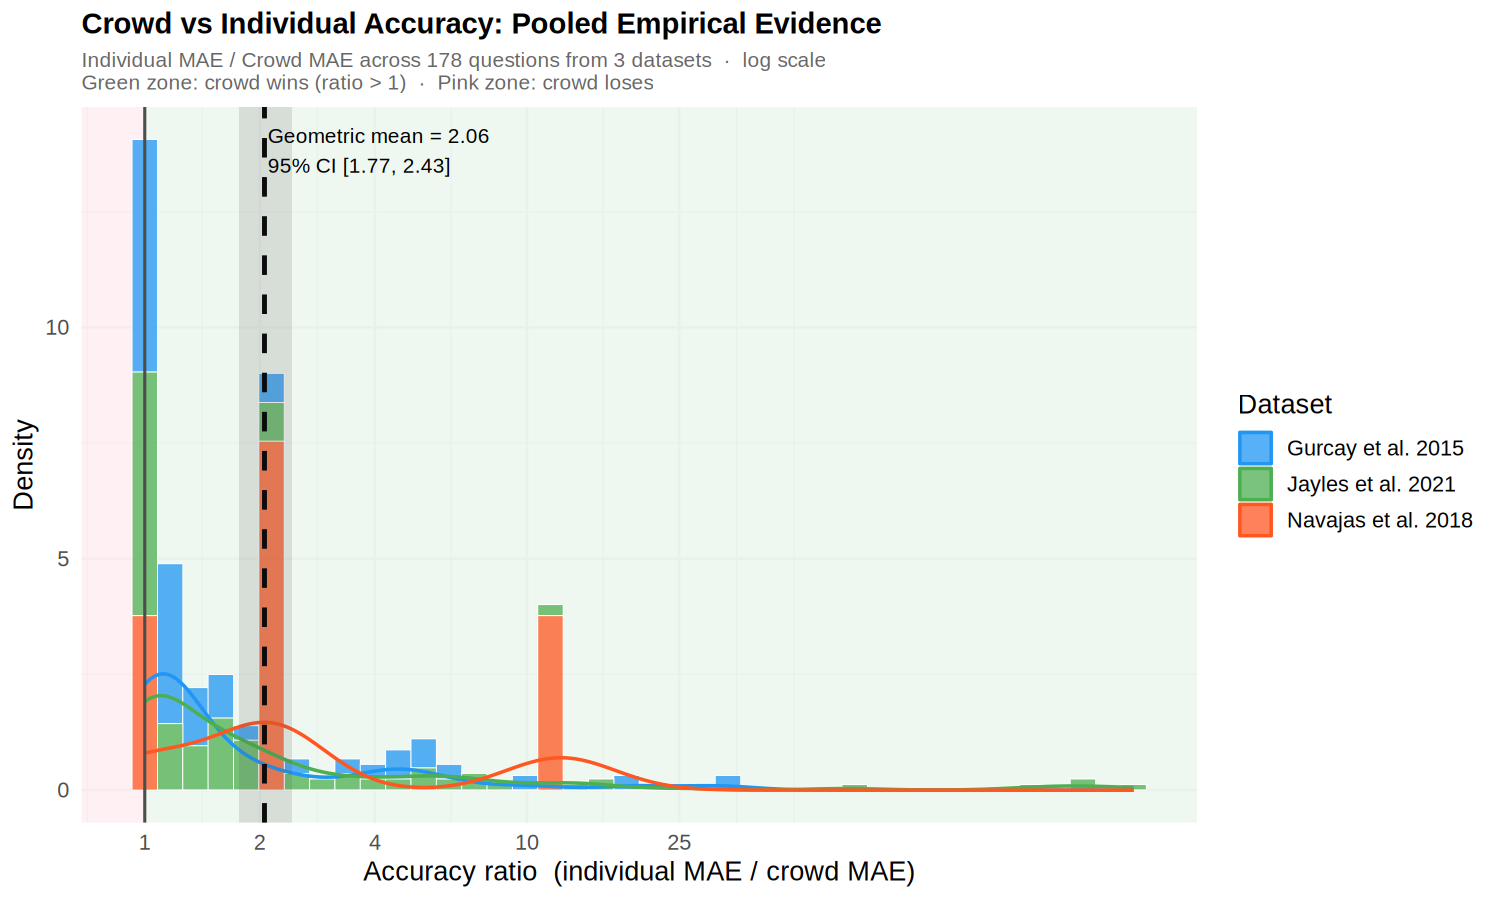
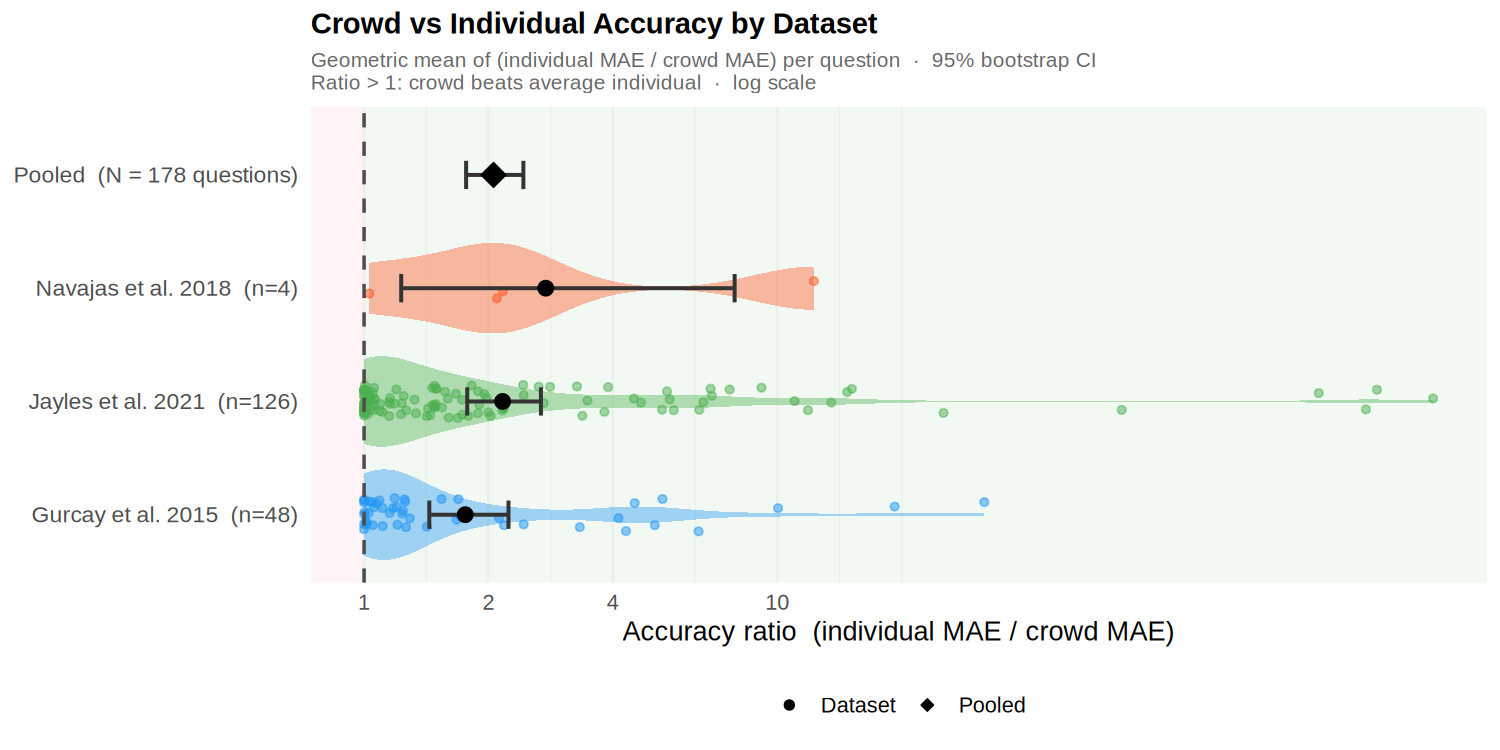
Empirical Analysis — Crowd vs. Individual Accuracy
Direct empirical comparison of crowd accuracy (group average) versus individual accuracy across 3 datasets with known true values (Gurcay et al. 2015, Navajas et al. 2018, Jayles et al. 2021), using mean absolute error (MAE) on round-1 estimates. Improvement ratio = individual MAE / crowd MAE; values above 1 indicate the crowd outperforms the average individual. Pooled geometric mean ratio = 2.06 (95% bootstrap CI: 1.77–2.43) across 178 questions — the crowd consistently beats the average individual by roughly a factor of two. (Kao 2018 and Mercier et al. 2022 are in the combined dataset but lack ground-truth values and are therefore excluded from this accuracy comparison.)
Paper 2 — Estimates Are Not Decisions
Citation: Pilgrim & Becker (2024). "Estimates are Not Decisions: How Wise Crowds Can Make Unwise Choices." Collective Intelligence 2024.
Core Finding: Vote–Average Decoupling
The Model
N people estimate M options. Option k has mean μk = k × S, standard deviation σ = 1. Each person votes for their highest estimate.
At S = 0.5 (candy-jar calibration), M = 3, N = 10:
P(decouple) ≈ 0.20 → wrong choice ~1 in 5 times
At S = 0.25:
P(decouple) ≈ 0.45 → wrong choice ~1 in 2 times
Illustrative Example (3 Voters, 2 Options)
| Option 1 | Option 2 | Vote | |
|---|---|---|---|
| Voter 1 | 40 | 20 | 1 |
| Voter 2 | 100 | 70 | 1 |
| Voter 3 | 10 | 110 | 2 |
| Average | 50 | 67 | – |
Average correctly identifies Option 2 as best (67 > 50), but the vote goes 2–1 for Option 1.
Datasets
| Study | Year | Design | N (approx) | Questions | Accuracy figs? |
|---|---|---|---|---|---|
| Gurcay, Mellers & Baron | 2015 | Two-round bounded/unbounded estimation | ~200 | 16 | Yes |
| Navajas et al. | 2018 | Swarm AI social influence | ~5000 | 6 | Yes |
| Jayles et al. | 2021 | Sorted vs random social information | ~1000 | 10 | Yes |
| Kao & Couzin | 2018 | Jar estimation, social info quantity | ~400 | 1 | No true value |
| Mercier et al. | 2022 | Discussion effects on estimation | ~300 | varies | No true value |
| Becker, Brackbill & Centola | 2017 | Network structure (PNAS) | ~1200 | 5 | Data unavailable |
Implications
The two papers together suggest that (1) social influence is not inherently harmful to collective intelligence — it can reliably improve individual accuracy — but (2) the aggregation method used to convert beliefs into decisions critically matters. Averaging dominates voting across a wide range of empirically realistic parameters.